Data Vizualisation & BI
Rubix
Implementation of a modern product performance framework built on Databricks and Power BI

Sommaire
Share :
Copier le lien
Introduction
Implementation of a modern product performance framework built on Databricks and Power BI, consolidating previously scattered data, improving information quality and accessibility, optimising sales and catalogue visualisation, and supporting product teams in the adoption of a unified, operational BI ecosystem.
Problem and Objective
A fragmented data landscape slowing product performance
With data distributed across 22 countries, Rubix’s product teams faced major continuity issues:
Key indicators were difficult to track, spread across files, local exports, and outdated reports
The migration process was hard to interpret
The product offering and sales volumes were difficult to analyse clearly
Outcome: teams were spending a significant amount of time rebuilding datasets and validating sources.
A need for unification to support growth
To sustain the group’s development, Rubix aimed to:
Rely on a harmonised, daily-updated data foundation
Provide a shared reference system across the organisation
Improve understanding of the product catalogue and commercial performance
Obtain clear answers quickly
Cross-analyse data from multiple domains to generate relevant insights
Manage large data volumes in a synthesised, readable format
Monitor operations directly from the database
The ambition: a robust, shared product performance system.
A clear vision: a unified and reliable product intelligence framework
Rubix wanted to enable the entire organisation to rely on:
A single, trusted data source, eliminating interpretation gaps
A practical working tool for specific projects: project monitoring, data exports directly from BI, high-level and detailed views
Simplified decision-making for strategic initiatives
The process
Stage 1
Redesigning product performance around Rubix's real operational context
Rubix operates in many European markets, each with different BI practices, technical histories and local constraints.
The project began with a detailed understanding of:
Existing architectures (Blob, Synapse, PostgreSQL, country exports)
How each team consumes data
Daily operational challenges
The challenge: modernise without disrupting operations, while building a more reliable and consistent foundation.
A co-constructed project with Rubix teams
The project was structured around regular workshops involving product teams, data engineers and analysts:
Progressive enrichment of tables based on business needs
Clarification of business rules
Continuous adjustments aligned with operational realities
Every decision was guided by actual analysis and reporting requirements.
A smooth integration into Rubix’s BI environment
Rather than replacing existing tools, the approach focused on convergence:
Structured migration of existing assets into Databricks
Creation of a clearer, more robust data architecture
Controlled migration from Qlik to Power BI
Standardisation of calculations, attributes and definitions
Result: a single entry point for all product and sales data.
Avant
Scattered data across multiple environments
Non-homogeneous reports across Qlik, Excel and Power BI
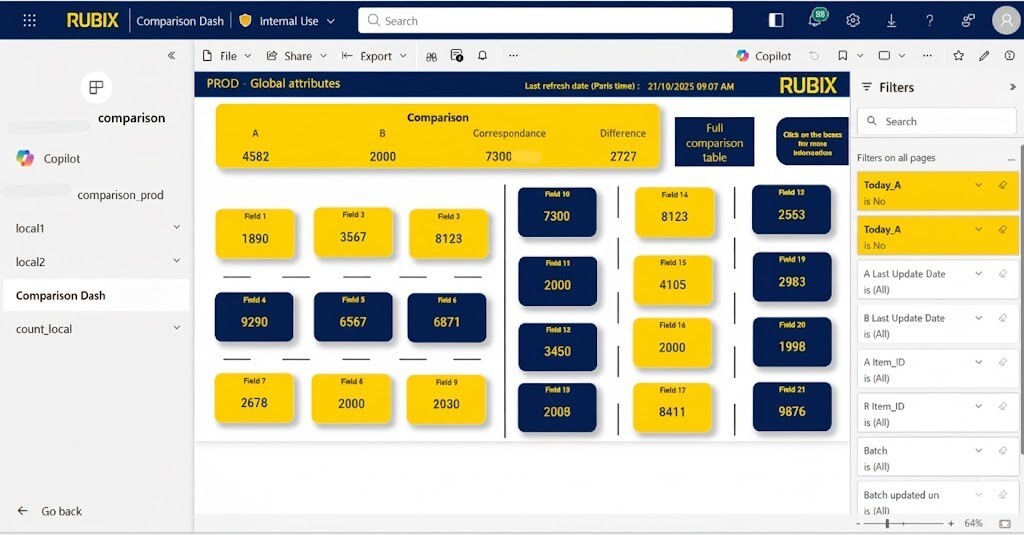
Migration progress difficult to interpret
Fragmented product and sales information
Après
Centralised data in Databricks
Power BI apps consolidating 20+ reports
Clear, step-by-step migration overview
Unified vision of the catalogue, sales and key attributes
Cross-analysis of domains and synthesised large datasets
Activity monitoring and detailed project tracking
The process
Stage 2
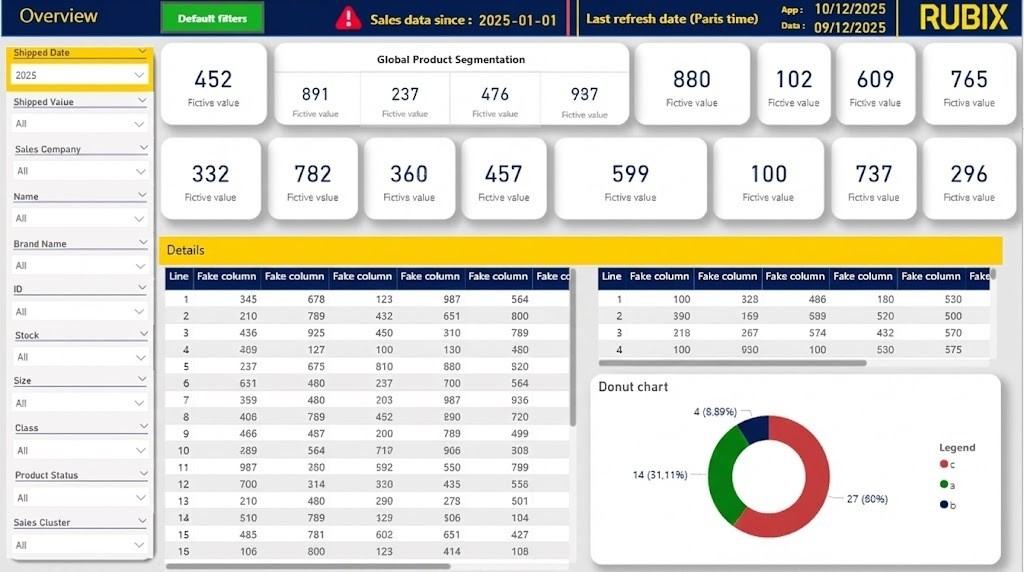
Dashboards designed for operational efficiency
The goal: surface the essentials instantly, without clutter.
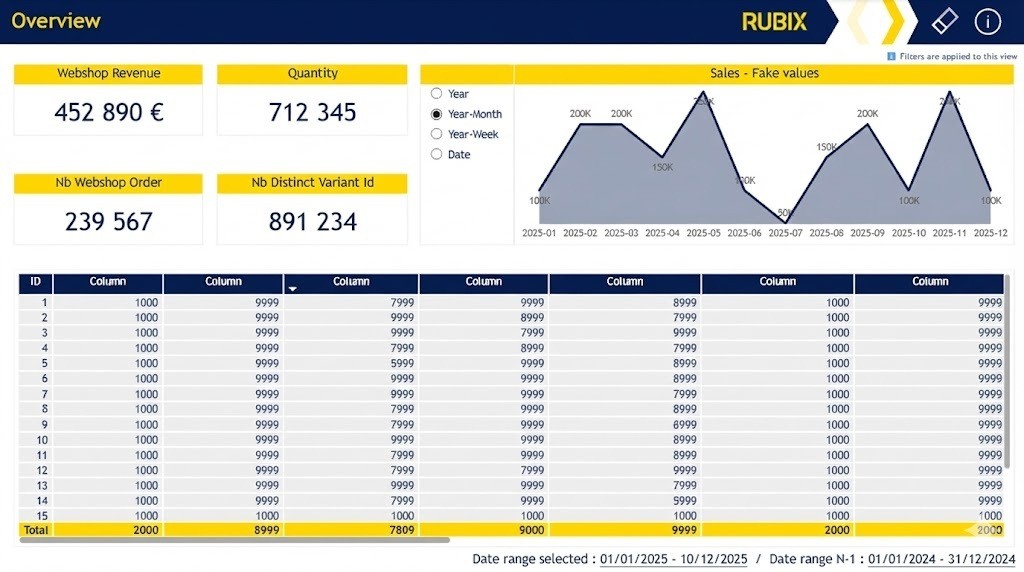
Dashboards were designed to:
Clarify essential catalogue attributes
Offer an immediate understanding of stock, sales and data quality
Replace Excel manipulations with direct visualisation
Provide both high-level and detailed views depending on the user
Fostering adoption through clarity and guidance
Adoption was accelerated thanks to:
Reports organised by business theme
Explicit metrics within the interface
Consistent visual standards across dashboards
Continuous support for teams
Avant
Long, repetitive Excel consolidations
Inconsistencies across multiple sources
Many tools, no global vision
Après
Dashboards aligned with each team’s actual needs
Automatically updated data
Drastic reduction in time spent rebuilding information
Enhanced migration and data quality monitoring
A smoother, more collaborative BI experience
Data exports available for project-specific analyses
Dashboards supporting decision-making and project tracking
Results and benefits
A technical foundation that strengthens all product performance processes
For product teams:
→ A consolidated view of sales, catalogue and migration progress.
For operational teams:
→ A unified, better-structured architecture with all dashboards centralised in Power BI.
A strengthened collective dynamic
Regular exchanges with Rubix teams led to:
A deeper understanding of the data
Continuous improvement of tables and indicators
Adoption was rapid because the solution addressed concrete needs and truly simplified daily work.
A solid and future-proof digital foundation
Rubix now progresses toward:
A centralised database
A coherent BI model
Scalable, durable dashboards
A system ready to support future organisational evolutions
A clear roadmap for upcoming developments
Consolidation of Databricks pipelines
Centralisation of BI tools
Leveraging Power BI innovations (pbip + Git)
Opening the way for data science use cases: forecasting, clustering, and more

